Tutorial: Set a breakpoint using Debugger
This page shows how you can try out the Debugger API yourself
using Firefox’s Scratchpad. We use Debugger to set a breakpoint in a function,
and then evaluate an expression whenever it is hit.
This tutorial was tested against Firefox 58 Beta and Nightly. It does not work in Firefox 57.
Since the
DebuggerAPI is only available to privileged JavaScript code, you’ll need to use the Browser Content Toolbox to try it out. To do this, open the Firefox developer tools, click on the options gear at the upper right of the toolbox, and make sure that both “Enable browser chrome and add-on debugging toolboxes” and “Enable remote debugging” are checked. These are located at the bottom right of the options panel; you may need to scroll to see them. Once they’re checked, you can close the developer tools.Save the following text to an HTML file:
<div onclick="report('the best div');">Click me!</div>
<div onclick="report('another great div');">Or me!</div>
<script>
function report(what) {
  console.log('clicked: ' + what);
}
</script>
Visit the HTML file in your browser, and open the Browser Content Toolbox by opening the Firefox menu, choosing “Browser Tools”, and then “Browser Content Toolbox”. If that item doesn’t appear in the “Browser Tools” menu, make sure you checked both boxes to enable the Browser Content Toolbox as explained in Step 1.
Our example code is long enough that the best way to run it is to use the Scratchpad panel, which is not enabled by default. To enable it, click on the options gear at the upper right of the Browser Content Toolbox, and make sure the “Scratchpad” box in the “Default Developer Tools” section the left is checked. The Scratchpad panel should appear at the top of the Toolbox alongside the Console, Debugger, and Memory panels.
Click on the Scratchpad panel and enter the following code:
const { addDebuggerToGlobal } = ChromeUtils.importESModule(
  "resource://gre/modules/jsdebugger.sys.mjs"
);

// This simply defines 'Debugger' in this Scratchpad;
// it doesn't actually start debugging anything.
addDebuggerToGlobal(globalThis);

// Create a 'Debugger' instance.
var dbg = new Debugger;

// Make the tab's top window a debuggee, and get a
// Debugger.Object referring to the window.
var windowDO = dbg.addDebuggee(tabs[0].content);

// Get a Debugger.Object referring to the window's `report`
// function.
var reportDO = windowDO.getOwnPropertyDescriptor('report').value;

// Set a breakpoint at the entry point of `report`.
reportDO.script.setBreakpoint(0, {
    hit: function (frame) {
        console.log('hit breakpoint in ' + frame.callee.name);
        console.log('what = ' + frame.eval('what').return);
    }
});

console.log('Finished setting breakpoint!');
In the Scratchpad, ensure that no text is selected, and press the “Run” button.
Now, click on the text that says “Click me!” in the web page. This runs the
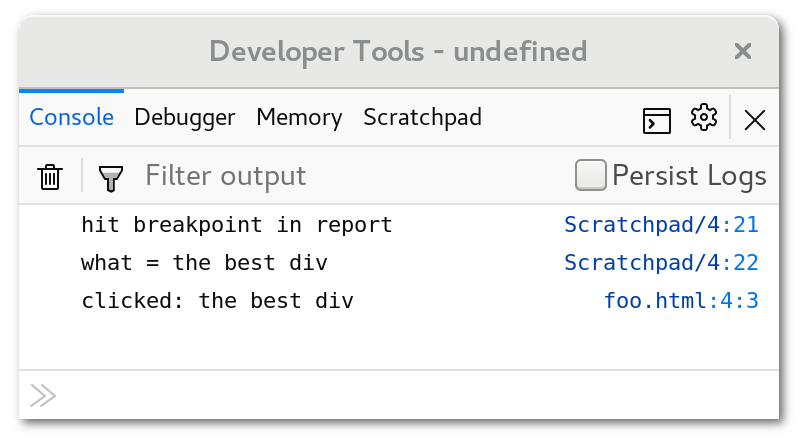
divelement’sonclickhandler. When control reaches the start of thereportfunction,Debuggercalls the breakpoint handler’shitmethod, passing aDebugger.Frameinstance. Thehitmethod logs the breakpoint hit to the browser content toolbox’s console. Then it evaluates the expressionwhatin the given stack frame, and logs its result. The toolbox’s console now looks like this:
You can also click on the text that says “Or me!”, to see
reportcalled from a different handler.If
Debuggeris unable to find thereportfunction, or the console output does not appear, evaluate the expressiontabs[0].content.document.locationin the console to make sure thattabs[0]indeed refers to the HTML file you visited. If you have more than one tab visiting afile:URL, they all share a single content process, so you may need to use a different element of the array as the debuggee.Press “Run” in the Scratchpad again. Now, clicking on “Click me!” causes the breakpoint hit to be logged twice—one for each
Debuggerinstance.Multiple
Debuggerinstances can observe the same debuggee. Re-running the code in the Scratchpad creates a freshDebuggerinstance, adds the same web page as its debuggee, and then sets a new breakpoint. When you click on thedivelement, bothDebuggers’ breakpoints are hit, and both handlers run.This shows how any number of
Debugger-based tools can observe a single web page simultaneously. In fact, you can use the Browser Content Toolbox’s Debugger panel to set its own breakpoint inreport, and it will trigger along with the first two. Keep in mind, however, that when multiple Debuggers share a debuggee, the order in which their handlers run is not specified. If more than one tool tries to influence the debuggee’s behavior, their combined behavior could be unpredictable.Close the web page and the Browser Content Toolbox.
Since both the Scratchpad’s global object and the debuggee window are now gone, the
Debuggerinstances will be garbage collected, since they can no longer have any visible effect on Firefox’s behavior. TheDebuggerAPI tries to interact with garbage collection as transparently as possible; for example, if both aDebugger.Objectinstance and its referent are not reachable, they will both be collected, even while theDebuggerinstance to which the shadow belonged continues to exist.