Telemetry Probe Alerting and Monitoring
Note
Telemetry Alerting was recently (April 2026) released in an open beta state, and we are actively looking for feedback and criticism of the system. If you hit any issues, have suggestions, or need to report something, please feel free to file bugs in the Testing :: Performance component on Bugzilla. You can find links to additional help below.
This document provides information regarding telemetry alerting, and monitoring. The change detection aspect of the project exists in mozdetect, and the alerting/monitoring aspect exists within Treeherder. Note that the alerting/monitoring may move out of Treeherder in the future.
Follow bug 1998556 to monitor upcoming improvements on this project.
Probe Setup
Note
Only Windows is currently available for platforms that can be alerted on due to a high number of false positives on Linux, and Mac. Follow this bug for progress on this issue. Android is disabled due to other issues and will be looked at here. Only timing_distribution probes are supported with the existing change detection technique.
To enable alerting or monitoring on a telemetry probe, the monitor field will need to be added to the metadata section of the probe definition. This will only work for timing_distribution probes, other probe types are not supported. See this probe for an example. The following provides all possible fields that will be accepted in the monitor field:
monitor:
  alert: True
  platforms:
    - Windows
    - Darwin
    - Linux
    - All
  bugzilla_notification_emails:
    - gmierz2@outlook.com
  lower_is_better: True
  change_detection_technique: cdf-squared
  change_detection_args:
    - threshold=0.85
    - short_term_spikes_ignored=True
Our telemetry change detection tooling provides the ability to either produce alerts in Bugzilla, or only produce emails for monitoring by probe owners. For only monitoring, this behaviour can be specified by either setting the monitor field to a boolean True value or setting the alert field to False.
Setting alert to True will enable alerting through bugzilla. When alert is set to True the monitor emails will no longer be sent to probe owners, and they will instead be notified of the changes through bugzilla bugs where they will also be need-info’ed. For alerting to work, the bugzilla_notification_emails must be set. Otherwise, bugs will not be produced since we cannot guarantee that the existing notification_emails setting for the probe has an email that is from a valid Bugzilla profile.
At the moment, we will only needinfo the first email in the bugzilla_notification_emails (subject to change). The other emails will be CCed on the bug. When only emailing is used, then all emails listed will receive an email.
If the probe has a notion of lower or higher values being better, the lower_is_better can be set. Otherwise, all changes are treated as generic changes and they won’t be classified as regressions or improvements.
Default Settings
When monitor is simply set to True or to a dictionary with no changes to change_detection_technique or change_detection_args then we provide a set of default values that should be usable for most cases.
The change detection technique used by default is cdf_squared or squared Cumulative Distribution Function (CDF) differences with a threshold that is determined automatically based on the Telemetry probe timeseries. This technique does not currently accept any arguments through change_detection_args. As mentioned above, this is in an open beta state, and if there are any issues, please reach out to us by either filling a bug in the Testing :: Performance component on Bugzilla, or through the channels listed in the additional help section below.
By default, only the Windows, Linux, and Darwin platforms are looked at. If the All platform is needed, it needs to be explicitly mentioned.
Limitations and Caveats
The default change point detection technique only works for telemetry probes that have numerical data (timing_distribution probes).
The detection only runs on Nightly data. See bug 1947262 for progress on performing detection in the Beta and Release channels.
The telemetry probe data must exist in the GLAM aggregate dataset (i.e. it must be viewable on the GLAM dashboard)
This is currently only available for GLEAN probes.
Android telemetry is not currently supported due to a bug.
Windows is the only desktop platform available for alerting due to a high rate of false positives on other platforms.
Monitoring Alerts
The primary ways of monitoring all alerts are either through this dashboard, and this bugzilla query. It’s possible that new views will be added to help with monitoring these alerts.
Understanding Alerts and Emails
The alerts that are received through emails look like this:
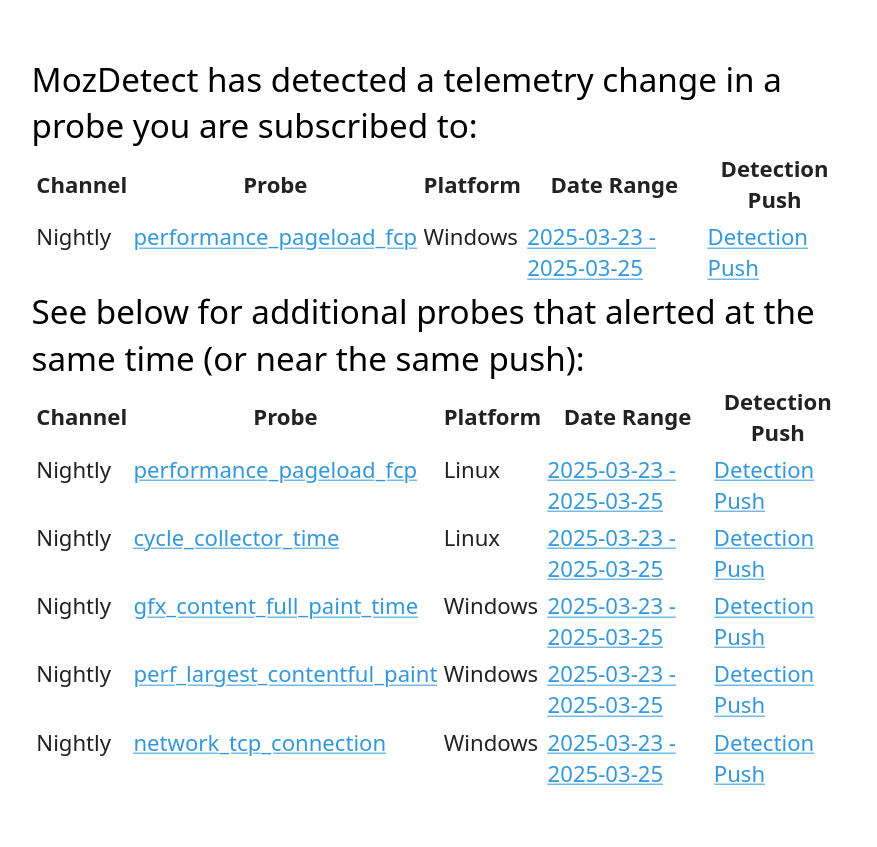
For email alerts, we leave it to the teams discretion on how to handle the alerts. There are no requirements to take action on them. The information provided in them consists of:
Probe: The probe that alerted which links to the GLAM dashboard to view the raw data.
Platform: The platform that produced the alert.
Date Range: The date range over which we believe the culprit is found on - this links to treeherder.
Detection Push: The exact push that the change was detected on.
There is also an additional section below which lists additional probes that had a change detected at the same time.
The alerts received on bugzilla are different and provide more information, but the expectations around them are higher (see the expected workflow below). They look like this (see here for a sample bug):
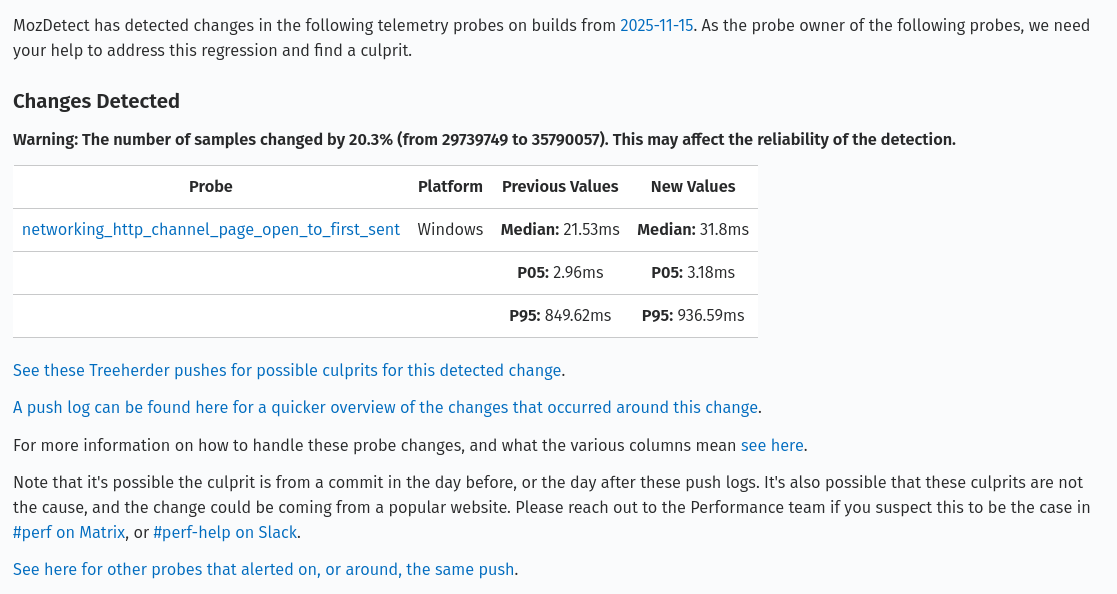
The information provided in the table consists of:
Probe: The probe that alerted which links to the GLAM dashboard to view the raw data.
Platform: The platform that produced the alert.
Previous Values: The previous median, 5th percentile (p05), and 95th percentile (p95).
New Values: The new median, 5th percentile (p05), and 95th percentile (p95).
There is also a warning that may appear above the table to warn owners when a large difference in sample counts is found. It is triggered if the difference between the before and after group samples exceeds 20%.
Alongside this table, there are links to help probe owners investigate the change. In the first paragraph, a date with a link to the exact push that produced the detection is provided. Below the table, there are links to Treeherder, and HG push logs to see all the patches that landed within the day of the detection. Links to documentation, and chat rooms that can be joined to get help are found here to. Lastly, there is a link to the telemetry alert dashboard to see if there are any additional probes that have alerted around the same detected push - over time more probes could alert and be shown there so checking it periodically can be useful. The dashboard will also show you alerts for telemetry probes that are strictly setup for email and do not produce bugs.
There’s also a graph attached to the bug showing the difference in CDFs that triggered the alert. It would look like this:
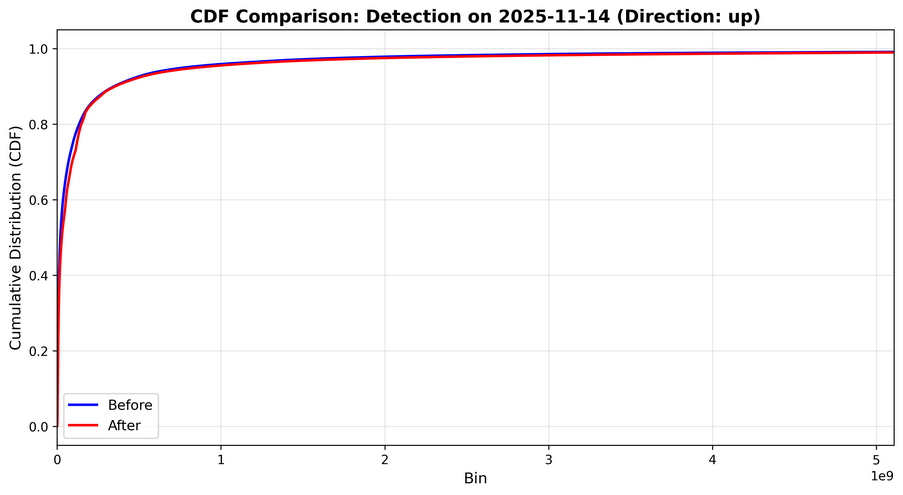
It can be used to help visualize the change that was detected. A CDF gives you the probability to see a value that is equal to or lower than it. For example, if a value of 1000 has a CDF value of 50%, that implies that there is a 50% chance that the values in this distribution have a value equal to or lower than 1000. In other words, 50% of the samples in the distribution have a value less than or equal to 1000.
Expected Workflow From Probe Owners
With telemetry probes that are only being monitored, there are no expectations of actions or a workflow from probe owners. We leave it to the teams discretion on how to handle those email alerts. These are tracked in the Telemetry Dashboard but it’s up to the owners to determine what to do with the notifications they receive as emails.
When it comes to telemetry probes that produce Bugzilla bugs, we expect the probe owners to begin investigating them within 3 days of the alert being produced. If no activity occurs on the bug in 7 days, a Bugbot rule will begin commenting asking for updates and some performance team members (or performance sheriffs) may begin pinging the probe owner in Matrix and/or Slack. See here for our guidelines/process on this in CI alerts which will also be applied here.
In the investigation, developers are expected to determine if there exists a potential culprit for the change detected in the range of pushes/commits provided in comment #0 in the alert bug. A link to a range of pushes in treeherder is provided for this. There is also a link to GLAM for the probe which should be verified to see if there’s a visible change in the probe metric on the date of the detection (i.e. the dates of the push range). It’s possible that the culprit exists just outside the range that was provided so it’s recommended to check +/- 1 day around the range that was provided to be sure that nothing was missed. If there are no potential culprit commits in the range of pushes, it’s possible the change in telemetry is unrelated to changes in the product.
When a culprit is identified, the culprit author needs to be notified of the alert and the probe owner will need to work with them to come up with a solution for the change. There are no requirements for the amount of time that can elapse between an alert being produced and the alert being resolved, however, it’s best to resolve them quickly and regular updates are expected.
There are 4 primary resolutions that can be provided for the alert bugs:
FIXED: The detected change was fixed with a follow-up patch, or a backout.
WONTFIX: The detected change is real and there is a valid culprit, but the change will not be fixed.
INVALID: The detected change is real, but there is no valid culprit and the change will not be fixed.
WORKSFORME: The detected change is attributed to noise in the telemetry probe metrics or otherwise is not a true detection.
The bug resolutions are directly reflected in the alert database and are updated on a daily basis.
Tooling Overview
Telemetry alerting is split into two parts. The first is the detection tooling which exists in the mozdetect repository. The second is the actual alerting/monitoring tooling that uses mozdetect and it exists in Treeherder (subject to change).
The change detection tooling is all defined in mozdetect, and Treeherder makes use of mozdetect to perform the detection on data from GLAM aggregation tables. This split allows us to easily test, and make new change detection techniques without being hindered by setting up Treeherder. Treeherder is only needed to test changes to the alerting/monitoring tooling. This includes:
Adding the detections into the database.
Associating detections with mozilla-central pushes.
Making alert bugs.
Sending emails.
Update alerts with bug resolutions.
General alert management.
Treeherder uses the get_timeseries_detectors method from mozdetect to find a list of detectors available and uses the change_detection_technique field defined in the probe to pick which technique to use (cdf_squared is used by default). Once the technique is determined, change detection is run on all specified platforms (by default all the platforms except for the All platform are used). Then, for all the detections returned, we parse the build ID into a mozilla-central push. This is then used to associate the alerts produced with a single detection push, along with a range of potential pushes.
These detections run once per day for all probes. After all alerts are created, the alert manager runs through four ordered steps:
Update existing alerts with new information from Bugzilla.
Create bugs for the new alerts.
Modify the bugs to link all alerting probes from the same detection push/range.
Notify probe owners that only requested monitoring of alerts through emails.
After probe owners are notified of the alerts, the Treeherder tooling ends and runs through this process again the next day.
Adding Change Detection Techniques
If you’re interested in adding new change detection techniques, or testing out existing ones. Head over to the mozdetect repository for information about how to do this. The process involves creating a new technique in that repo, and then updating the module in Treeherder to make it available.
Additional Help
Reach out to the Performance Testing, and Tooling team in the #perftest channel on Matrix, or the #perf-help channel on Slack. Bugs can be filed in the Testing :: Performance component on Bugzilla.