Debugging WebRTC Calls
Reporting WebRTC Call Issues
The best way to report an issue is through Bugzilla using this link. Describe the issue you’ve run into, include a URL, along with the details of the call setup. See the Adding Call Setup Information section for helpful templates. Here are some common examples of descriptive WebRTC bug summaries:
caller is experiencing frozen video, screen capture, or desktop capture
caller does not hear audio
caller’s voice sounds distorted or robotic
video resolution is lower than expected
caller’s video appears rotated
there is significant delay between a caller’s video and audio
camera, microphone, or screens are not appearing in the Firefox device access permission prompts, etc.
caller’s video is garbled, partially missing, or the colors are incorrect
caller can not share external display, but can share integrated display
Note
Not all web conferencing software makes extensive use of WebRTC.
For simple issues, the first place to look is to check the web developer console for error messages related to media format issues. If you see messages here related to WebRTC, getUserMedia, or getDisplayMedia, please add this information to your bug.
Adding Call Setup Information
The following template can help one provide all the call details needed to diagnose many common issues.
* Does this problem occur in Firefox for Desktop or Android?

* Is this problem reproducible in Firefox Nightly?

* Has this worked previously?

* Have you tried using `about:profiles` to reproduce the problem in a
  clean profile?

* How many participants were in the call?

* In which web conferencing or web calling services does the problem occur?

* Does the problem present itself immediately upon starting the call?

* If not how long does it take to occur?

* If this is a problem with audio or video capture, what camera or microphone
  are you using? (adding about:support text may be helpful)

* If this is problem with screen capture, which screen was being captured,
  and are there other screens attached to the same machine?

* Would you be willing to help us find a regression range?
If the issue is of specification compliance the template provided below may be more useful. If one is unsure if this is a compliance issue, one can refer to the Standards Documentation section for links.
* What unexpected behavior is being observed? What are the steps to reproduce
  this issue?

* What is the expected behavior?

* Where is this behavior specified?

* Is this problem reproducible in Nightly?

* Have you tried using `about:profiles` to reproduce the problem in a clean
  profile?

* Has this worked previously?

* If so, would you be willing to help us find a regression range?
Adding about:support Text
In your Bugzilla report, please include support information about the current device on which you are experiencing an issue.
Open a tab and visit about:support
Click ‘Copy Text to Clipboard’
Paste this text in your Bugzilla bug comment and post.
Note
To open about:* links in Firefox one must do the following:
. Right-click the link and select Open Link in New Tab
. Select the new tab
. Click inside the address bar which should contain the about URL
. Press Enter
Adding about:webrtc RTCPeerConnection Stats
Open about:webrtc.
Expand the RTCPeerConnection section.
Locate and expand the subsection RTCPeerConnection that one wishes to copy stats from.
Press the
Copy Stats ReportIn the Bugzilla bug, press the
Attach New Filebutton.Click inside the large text box labeled
File, and paste the copied stats report.Add a descriptive label to the the
Description:, e.g. “PeerConnection statistics sample taken during period of frame loss”.In the drop down box, next to the
select from listradio option, select “JSON source (application/json)”.If needed, add a descriptive comment to the
commentfield.Press the
Submitbutton.
Note
Hovering the mouse over some headings will reveal a clipboard icon. Clicking
this icon will copy the contents under that section to the clipboard as a
JSON document. This can be useful if one wants to submit a portion of the
available stats. Of particular note are the RTP Stats heading whose
button will copy the latests RTP stats, and the SDP section whose
button will copy the SDP offer; answer; and roles.
Adding Your about:webrtc Contents
For issues with call quality, please share web conferencing related performance information by providing your about:webrtc information. Note this information should be collected while the call in question is still active.
While your call is still ongoing, open an additional tab and visit about:webrtc.
Click “Clear History” to clear the stats from other recent calls which are no longer ongoing.
At the bottom of the page click ‘Save Page’, and save this file.
Add this file as an attachment to your bug.
This data contains statistics about your call, the signalling that was used to setup your call, and information about the network transports.
Diagnosing Call Quality Issues
about:webrtc Overview
about:webrtc is an in-browser resource for debugging WebRTC calls. The primary audience for about:webrtc is browser developers but it can also be of use to anyone that needs to troubleshoot a WebRTC call. When there is no call data to display, about:webrtc will appear as follows:
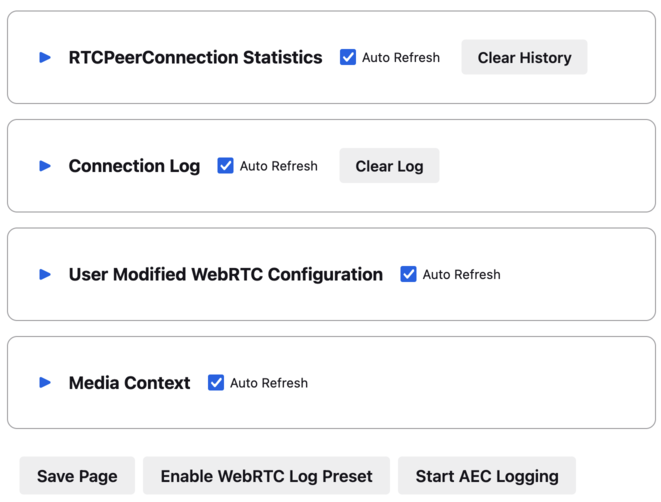
about:webrtc before any calls have been made
Note that there are several sections. During a call each section will contain information pertinent to different aspects of the WebRTC browser implementation.
RTCPeerConnection Statistics
This section presents information useful for diagnosing active calls. It contains RTCPeerConnection creation parameters, connection information, negotiation details, RTP stream statistics, bandwidth statistics, and output frame statistics.
Connection Log
When one needs to diagnose issues with the underlying transports, logs can be found under Connection Log.
User Modified WebRTC Configuration
This section will display any user modified preferences which effect the performance or behavior of browser components which can impact WebRTC calls. When hovering over a preference path displayed in this section a clipboard icon will appear. Clicking that icon will copy the path to the clipboard. It can then be pasted into about:config, to change or reset the value to its default.
Warning
Unexpected values in this section may be caused by installed extensions. It is best to test issues in a clean profile when possible using about:profiles.
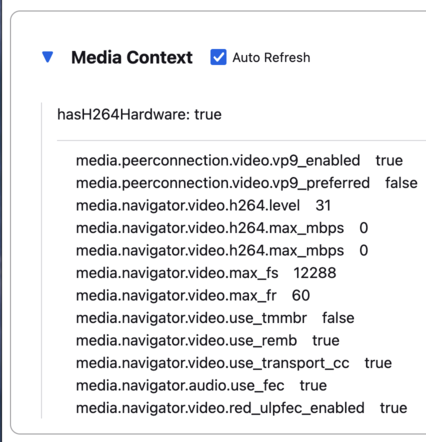
Media Context
Information that is gathered to determine Codec availability and capability is recorded under Media Context.
Bottom Control Bar
At the bottom of about:webrtc is a row of buttons which allow the user to perform miscellaneous actions.
The Save Page button expands all the sections and presents a dialog to save
the contents of the page. This will produce an HTML file suitable for attaching
to bug reports.
In the event of a WebRTC issue, the Enable WebRTC Log Preset button is a very
quick way to start logging. Pressing that button will open a new tab with
about:logging with the webrtc preset selected. This
preset contains all Standard Logging Modules. Logging
will begin immediately. If one needs to change other log settings on that page
one can customize them, and then press Start Logging. This may be
necessary if one wishes to log to the profiler.
If experiencing echo cancellation issues, one may be asked to submit echo
cancellation logs. These logs are gathered by pressing the
Start AEC Logging button. One should press the button to activate
the logging while actively experiencing an echo cancellation failure.
Note
Producing echo cancellation logs is incompatible with the content sandbox.
The user will be prompted with further instructions if the sandbox is active
and the Start AEC Logging button is pressed.
Audio/Video Delay
Delayed media is commonly caused by long physical paths between endpoints, though anything that slows down inter-hop delivery of packets can be at fault. Note that this is different than the bandwidth of the network path, and a high latency will not be fixed by reducing the video resolution or audio sample rate. Round trip time, or RTT, is the time it takes for a packet to get from the sender to the receiver and then for a packet to get from the receiver back to the sender. If the path is symmetric between the two endpoints one can assume that the one way delay is half the delay of the round trip.
The second common cause of A/V delay is jitter, the magnitude of variability in packet inter-arrival times. In order to smoothly play out of the incoming stream a receiver experiencing jitter will have to buffer (delay) incoming packets.
Using about:webrtc to Diagnose Delay
The key metrics in about:webrtc are RTT (round-trip-time) and jitter. They can be found in the RTP stats section of the PeerConnection. The PeerConnection informational blocks start out in a minimized state, and one will need to expand a block to find the RTP stats section:
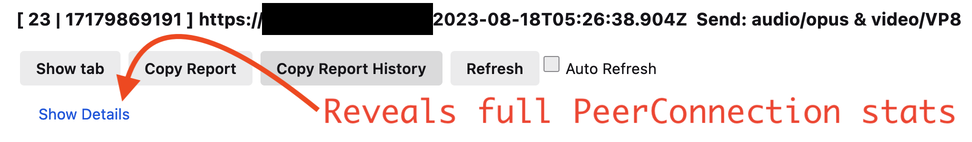
How to reveal the full statistics of a PeerConnection in about:webrtc
Once expanded one can locate the RTP Stats section and find the key diagnostic stats:
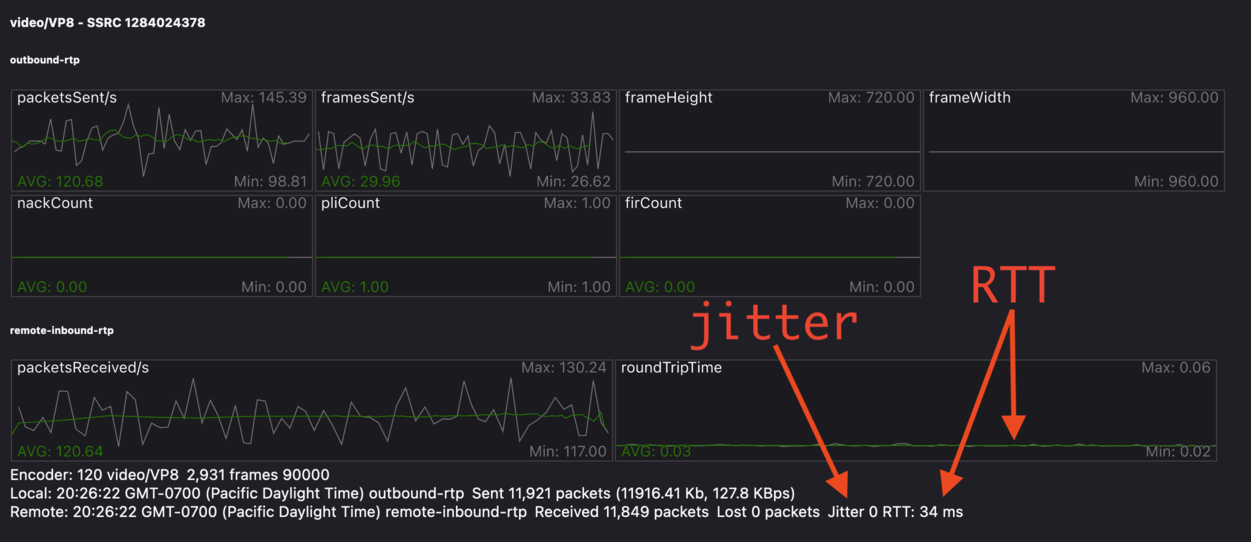
Location in about:webrtc of jitter and RTT stats
In this image we can see that there are 0 milliseconds of jitter, and 32 milliseconds of round trip delay. This call should not be experiencing any noticeable delay. See the Delay Calculation appendix section below for some more detail.
If the perceived delay is larger than the estimated delay that could indicate a problem within Firefox that requires debugging. Under these circumstances it would be helpful to grab a JSON copy of the current stats by pressing the “Copy Report” button, pasting those stats into your Bugzilla bug report.

Location in about:webrtc of Copy Report button
Performance Profiling and Logging
Capturing a Firefox Performance Profile
For basic performance issues, a performance profile can help engineers diagnose issues with video formats, performance, and rendering.
Visit https://profiler.firefox.com/ and enable the Profiler toolbar button.
Click the toolbar button down arrow and select ‘Media’ in the Settings drop down.
Open a tab and visit the page with the affected media content.
Click the Profiler toolbar main button to start recording.
Play media until the issue you are seeing manifests.
Click the Profiler toolbar button again to stop recording.
When a new Profile tab opens, click the upload profile button on the upper right.
Copy the resulting profile URL and post this to your Bugzilla report.
Additionally, detailed logging can be collected within performance profiles to help aid in debugging complicated issues. To enable the collection of a profile with low level debugging -
Visit https://profiler.firefox.com/ and enable the Profiler toolbar button.
In a new tab, visit about:webrtc. Click the ‘Enable WebRTC Log Preset’ button, which will open a tab for about:logging with pre-populated information.
In about:logging, click the “Start Logging” button. (You are now recording a profile, the profiler toolbar toggle button should be selected automatically.)
Open a new tab for testing and view the media you are having an issue with. (After reproducing, DO NOT close this test tab yet.)
Switch to the about:logging tab, click ‘Stop logging’, and then close the test tab.
Wait approximately 10 - 20 seconds for a new tab to automatically open containing the generated performance profile.
Within the upper-right side of the profiler tab click the ‘upload local profile’ button to initiate profile upload. Once the upload is complete, a drop down text field will open displaying the URL of the profile. Select this text and copy it.
Share the URL of the profile for analysis with the engineer you are working with.
Alternatively one can set the following environment variable:
MOZ_LOG="jsep:5,sdp:5,signaling:5,mtransport:5,nicer:5,RTCRtpReceiver:5,RTCRtpSender:5,RTCDMTFSender:5,WebrtcTCPSocket:5,CamerasChild:5,CamerasParent:5,VideoEngine:5,ShmemPool:5,TabShare:5,MediaChild:5,MediaParent:5,MediaManager:5,MediaTrackGraph:5,cubeb:5,MediaStream:5,MediaStreamTrack:5,DriftCompensator:5,MediaRecorder:5,MediaEncoder:5,TrackEncoder:5,VP8TrackEncoder:5,Muxer:5,GetUserMedia:5,MediaPipeline:5,WebAudioAPI:5,webrtc_trace:5,RTCRtpTransceiver:5,ForwardedInputTrack:5,HTMLMediaElement:5,HTMLMediaElementEvents:5"
Standard Logging Modules
Module |
Component |
Function |
Notes |
|---|---|---|---|
jsep |
signalling |
JSEP state machine |
|
sdp |
signalling |
SDP parsing |
|
mtransport |
networking |
Network transports |
|
nicer |
networking |
ICE stack |
|
RTCRtpReceiver |
JS API |
JS API related to receiving media and media control packets |
|
RTCRtpSender |
JS API |
JS API related to sending media and media control packets |
|
RTCDMTFSender |
JS API |
JS API related to sending DTMF messages |
|
WebrtcTCPSocket |
networking |
||
CamerasChild |
media capture |
Content process end of IPC channel for receiving frames from media capture devices |
|
CamerasParent |
media capture |
Parent process end of IPC channel for sending frames from media capture devices |
|
VideoEngine |
media capture |
Orchestrates capture of frames from media capture devices in the parent process |
|
ShmemPool |
media capture |
Object pool of shared memory frame buffers for transferring media capture frames from parent to child process |
|
TabShare |
media capture |
Captures tab content for sharing |
|
MediaChild |
media |
||
MediaParent |
media |
||
MediaManager |
media |
||
MediaTrackGraph |
media |
||
cubeb |
media |
||
MediaStream |
media |
||
MediaStreamTrack |
media |
||
DriftCompensator |
media |
||
MediaRecorder |
media |
||
MediaEncoder |
media |
||
TrackEncoder |
media |
||
VP8TrackEncoder |
media |
||
Muxer |
media |
||
MediaPipeline |
network |
Glue code between transport, media, and libwebrtc components |
|
WebAudioAPI |
|||
webrtc_trace |
webrtc |
libwebrtc logging |
Prior to Firefox v123 it must be enabled from
about:webrtc at runtime, or it must be set in the
|
RTCRtpTransceiver |
JS API |
implements the RTCRtpTransceiver object |
|
HTMLMediaElement |
|||
ForwardedInputTrack |
|||
HTMLMediaElementEvents |
Non-standard Logging Modules
Module |
Component |
Function |
Notes |
|---|---|---|---|
RTPLogger |
network |
Logs RTP and RTCP packet fragments |
Examining Call Performance Issues
Enabling Call Stats History
Call stats history is enabled by default in Nightly. To enable in release builds open about:config, and change “media.aboutwebrtc.hist.enabled” to true. This will keep a history window of stats for a number of recent calls, allowing for inspection in about:webrtc after a call has completed.
Dumping Call Stats
One can dump a JSON blob of call stats for an active call, or a recent call if call stats history is enabled. There are two buttons in about:webrtc to do this, “Copy Report” and “Copy Report History”. The former will create a copy of the most recent stats for the PeerConnection. The later will copy all the history of stats reports that about:webrtc has accumulated for that PeerConnection, this can be up to several minutes of stats.
Debugging Encrypted Packets
Warning
There is a blog post covering dumping unencrypted partial RTP and RTCP packets in the logs. While the information presented in that post is still relevant, the command to extract the packet data in the blog is out of date. A working method is presented below;
Using the gecko logging system, unencrypted, mangled, partial, RTP-packets can be written out. This may be a good avenue of investigation for packet loss and recovery, simulcast, and feedback. Because the entirety of the packet is not guaranteed to be logged, this is less suitable for debugging issues with encoded media. These logged packets can be converted to PCAP files, which can then be explored in Wireshark. The logs produced by this module can be quite large, making it easy to identify by file size which child process log files contain packet dumps.
To start RTP logging, one must enable the RtpLogger log module. The sync
option should also be used, as it prevents undesirable interleaving of log
messages. Here are the minimal log settings needed:
MOZ_LOG='sync,RtpLogger:5'
In order to interpret the packet contents, one needs to refer to the SDP. Wireshark is unaware of the negotiated details, so it can not directly decode the media, nor can it decode the header extensions. The SDP can also be logged, and so the following is a more useful set of log settings:
MOZ_LOG='sync,RtpLogger:5,jsep:5'
Note
On macOS it is simple to install Wireshark and text2pcap with Homebrew:
# Use only one of the following:
# ==============================

# To install the Wireshark GUI application and the command line utilities:
brew install --cask wireshark

# To install only the command line utilities:
brew install wireshark
One can use tee to capture log output
from a copy of Firefox launched from the command line, e.g. through
mach. Alternatively, one can set a log file through the environment
variable MOZ_LOG_FILE or through about:logging.
Warning
If log files are not being created by child processes, this is likely due to sandboxing of content processes. To work around this one must either select a location within the sandbox, disable the content sandbox, or launch Firefox from the command line, e.g. from a Firefox dev environment:
MOZ_LOG=sync,RtpLogger:5,jsep:5 MOZ_LOG_FILE= ./mach run 2>&1 | tee your.log
To produce a PCAP file one needs to filter the logs to include only the RtpLogger log lines, reduce them down to the expected ingestion format for text2pcap, and finally to invoke text2pcap.
cat your.log | rg 'RtpLogger.*RTC?P_PACKET|>>\s(?P<packet>.+$)' --only-matching --replace '$packet' | text2pcap -D -n -l 1 -i 17 -u 1234,1235 -t '%H:%M:%S.' - your.output.pcap
Note
If rg, a.k.a ripgrep, is not already available, one can install it via one of the following methods:
# Install through cargo on macOS, Linux, or Windows
cargo install ripgrep

# Install via Homebrew on macOS
brew install ripgrep

# ripgrep packages may be available through the package manager for your
# Linux distro
The resulting PCAP file can be explored with Wireshark. Currently, one must refer to the SDP in order to interpret the RTP packets.
# On most Linux distros
wireshark -d 'udp.port==1234,rtp' your.output.pcap

# On macOS when installed via Homebrew
open /Applications/Wireshark.app --args -d 'udp.port==1234,rtp' your.output.pcap
Examining Codec Availability and Capabilities
When codec negotiation doesn’t happen as expected there are several helpful locations where one can find information. The SDP offer and answer contain the list of codecs that were in the initial offer, and the subset of those codecs that were selected in the answer.
The easiest way to get this information on a live call is through about:webrtc. Each RTCPeerConnection has its own subsection, that when expanded contains an SDP section. There are buttons to display the offer and the answer. Depending on which party was the offerer and which was the answerer one may have a local offer and a remote answer, or a remote offer and a local answer.
Firefox chooses which codecs to offer based on availability. Some codecs, like Opus or VP8, are always available. Some codecs are available in software and some codecs on some platforms are available in hardware. H264 support is provided by a third-party, and is automatically downloaded the first time its use is requested. This is a process which can take a variable amount of time depending on network circumstances.
Note
A list of media codecs with playback support are available in the Media section of about:support#media . Not all media codecs present and available to Firefox for playback are supported in WebRTC calls.
To check the current factors, including preferences, that are being used to
calculate availability beyond codec presence, one can check the Media Context
section of about:webrtc.
For an in-depth reference covering the codecs available through WebRTC please see the MDN Page: Codecs Used by WebRTC.
Running WebRTC Tests
There are a variety of tests providing coverage over WebRTC related code. The
Web Platform Suite provides conformance tests for browsers. The
gtest suite is composed of unit tests. Crashtests are a type of
regression test which are written to induce crashes. There are fuzzing tests
which exercise APIs in ways that the authors did not foresee. All of the WebRTC
tests can be run locally with mach or in CI on Try. There is a
detailed overview of all available test types including those not exercised by
WebRTC code here.
Note
Running ./mach <verb> --help is an indispensable tool for discovering
options that can streamline your testing process.
Note
A test suite on Try maybe an aggregate of multiple logical test suites.
For example, the mochitest-media suite on try includes both the WebRTC and
playback mochitests.
Warning
WebRTC calls make use of a number of internal timers. Amongst the
behaviors these timers control are transport selection, bandwidth estimation,
packet loss determination, media adaptation, lip sync, connection timeout,
and more. There are Try targets which are too slow to reliably run a
number of the tests. Before running a specific test on Try for the first
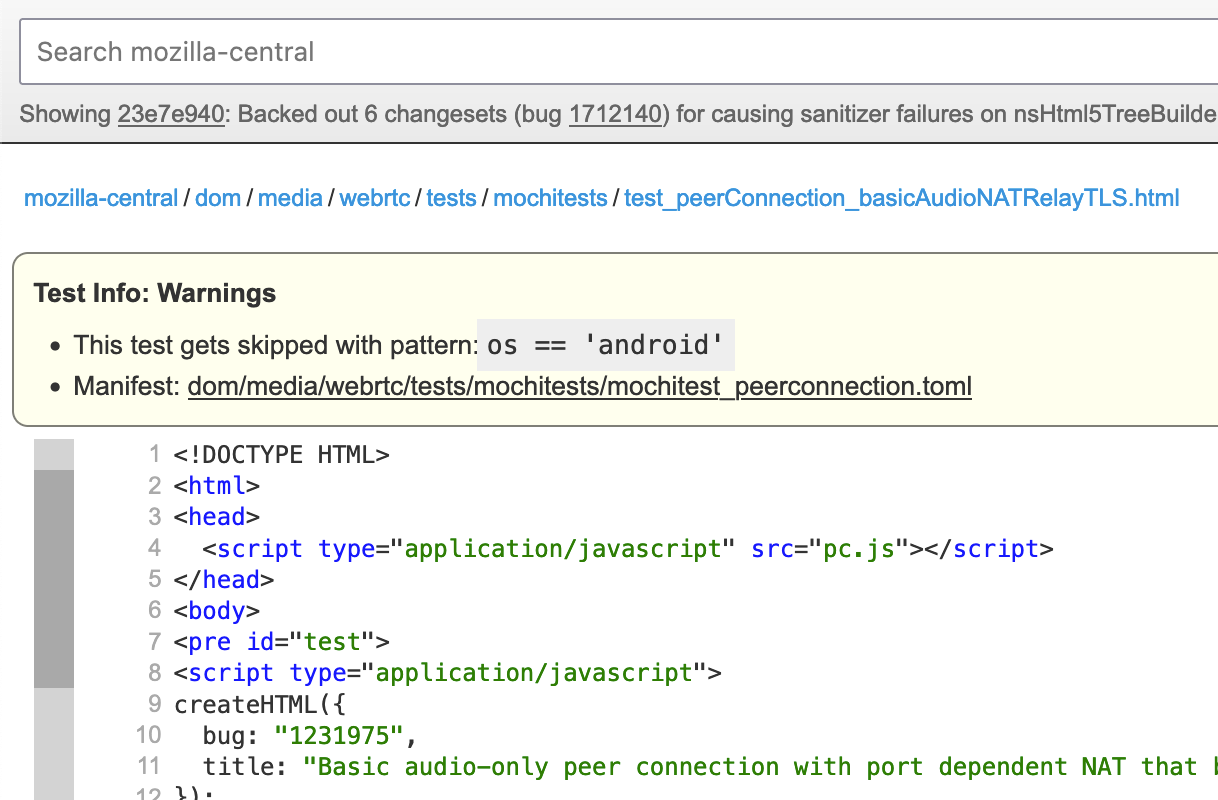
time, it may be best to check the relevant test suite manifest. This can be
done easily with Searchfox.org by searching for and viewing a test file. If
that test has been disabled on one or more platforms the details will appear
as shown below:
Test Atlas
Component |
Test type |
Test file location |
Try suite |
Treeherder Abbreviations |
|---|---|---|---|---|
WebRTC |
Mochitest |
dom/media/webrtc/mochitests |
mochitest-media |
|
Web Platform Test |
testing/web-platform/tests/webrtc |
wpt |
|
|
Crashtest |
dom/media/webrtc/tests/crashtests |
crash |
|
|
WebRTC Signalling |
GTest |
media/webrtc/signaling/gtest |
gtest |
|
WebRTC (gUM / gDDM) |
Browser Chrome Test (mochitest) |
browser/base/content/test/webrtc |
browser-chrome |
|
WebRTC Transport |
CPPUnit |
dom/media/webrtc/transport/test |
cppunit |
|
fuzztest |
dom/media/webrtc/transport/fuzztest |
fuzzing |
||
SDP parser |
Fuzzing |
dom/media/webrtc/tests/fuzztests |
fuzzing |
Web Platform Tests
The WPT suite comprises conformance tests for various W3C specs such as: CSS,
JS APIs, and HTML. WebRTC is a JS API and as such its tests are of the testharness.js type.
There is detailed WPT documentation available here
Web Platform Tests can be run locally from
# Run the entire WebRTC WPT test suite
./mach wpt testing/web-platform/tests/webrtc

# Run a single test, e.g. RTCPeerConnection-createAnswer.html
./mach wpt testing/web-platform/tests/webrtc/RTCPeerConnection-createAnswer.html

# Run all of the PeerConnection tests, i.e. RTCPeerConnection-*.html
# NOTE that the `mach` verb in use is `test` not `wpt`
./mach test testing/web-platform/tests/webrtc/RTCPeerConnection
Warning
Running the WPT tests locally can be very disruptive to one’s working
desktop environment, as windows will frequently appear and grab focus. Using
mach’s --headless flag will prevent this, and can be a great
way to run them if one’s problem can be evaluated from command line output.
These tests are synced from the main Web Platform Test repository, and likewise our changes are synced from our in-tree copy back to that repository.
Warning
Running the WebRTC mochitests in Try is done using the entire Web Platform Test suite, wpt.
As such, this can be slow.
./mach try fuzzy --query 'wpt'
One can run those same tests in
Chromium,
Safari, or Servo if one needs to compare behavior between browsers. This can be
done directly through mach, see running tests in other browsers
for more details.
Mochitests
The WebRTC mochitests are integration tests, regression tests, and sanity tests. The needs of these tests did not align with specification conformance testing in the WPT, Web Platform Test, suite. Before writing a new mochitest, one should consider if a test would be better expressed as a WPT, which all browsers can test against.
Locally running the WebRTC mochitests should be done in a Firefox dev
environment using mach as follows:
# Run the whole suite
./mach mochitest dom/media/webrtc/tests/mochitests

# Run a single test, e.g. test_peerConnection_basicAudioVideo.html
./mach mochitest dom/media/webrtc/tests/mochitests/test_peerConnection_basicAudioVideo.html
# Or
./mach mochitest test_peerConnection_basicAudioVideo.html

# Run all of the PeerConnection tests, i.e. test_peerConnection_*.html
./mach mochitest test_peerConnection
On try, WebRTC mochitests are part of the larger media test suite.
This suite can be easily selected with the following fuzzy query:
# Run the media mochitest suite on all regular platforms
./mach try fuzzy --query 'mochitest-media'

# Run the media mochitest suite only on Linux which will resolve far faster
./mach try fuzzy --query 'linux mochitest-media'
GTests
The gtests are all compiled into a single library target: xul-test.
This makes running gtests from mach slightly different than the other
test types.
# Run a single test by using Prefix.TestName, e.g. JsepSessionTest.FullCall
# :searchfox:`mozilla-central/rev/4d6a5b97428760d15bfcad13f8fc81439370a7ec:media/webrtc/signaling/gtest/jsep_session_unittest.cpp#1551`
./mach gtest 'JsepSessionTest.FullCall'

# Run all the tests in a single Prefix, e.g. JsepSessionTest
./mach gtest 'JsepSessiontTest.*'

# Run all tests which have a Prefix.TestName containing the substring 'Jsep'
# See the table of selectors below
./mach gtest '*Jsep*'

# Run all the gtests for Firefox
./mach gtest
Here is a list of helpful substring selectors for executing specific WebRTC gtests:
Selector |
Description |
Files |
|---|---|---|
|
JSEP (signalling) tests |
|
|
SDP parsing tests |
|
|
MediaPipline and MediaPipeline filter tests for RTP media handling |
|
|
AudioConduit tests for libwebrtc glue for RTP audio media |
|
|
VideoConduit tests for libwebrtc glue for RTP video media |
For more general information about gtests see the documentation here.
Fuzz Testing
It is not common to need to run fuzz testing as it is run on a semi-continuous fashion in CI. It is more likely that one will need to respond to a bug filed by a fuzzing bot. If one is interested in fuzzing one should consult the excellent documentation available here.
Code Atlas
There are a number of components that work together to create a successful WebRTC call. When debugging a call it can be difficult to see the larger puzzle for all the pieces. A listing of the WebRTC related source code directories is provided below to help one navigate.
Directory |
Component |
Description |
Notes |
|---|---|---|---|
WebRTC |
This is the primary directory for Firefox WebRTC code |
||
WebRTC |
This contains WebRTC related utility code |
||
JS API |
This contains the C++ implementations of the JavaScript WebRTC interfaces |
||
Signalling |
This is the JSEP state engine implementation |
||
WebRTC (various) |
This is the glue code between libwebrtc and Firefox |
||
WebRTC (various) |
Firefox-specific overrides for libwebrtc components |
||
Signalling |
This contains the SDP parsing interface |
||
Tests |
This contains some of the WebRTC related tests |
||
Build |
The scripting and configuration for vendoring new versions of libwebrtc are here |
This is unlikely to be of concern for debugging |
|
Network |
This contains the ICE implementation, the MDNS implementation, and transport code |
||
Network |
IPDL protocols for WebRTC transport, including STUN address requests and WebRTC TCP sockets |
||
WebRTC |
This contains the MediaPipeline and MediaPipeline filter code which is glue between transport and the libwebrtc RTP stack |
||
Network |
This is the SRTP implementation used by Firefox |
||
WebRTC (various) |
libwebrtc handles many aspects of WebRTC calls above the transport layer and below the presentation layer |
||
Signalling |
webrtc-sdp is a Rust implementation of a WebRTC-only SDP parser |
||
Signalling |
sipcc is a C implementation of a general SDP parser |
this carries many local modifications |
|
Media Capture |
GetUserMedia and related classes are here |
There are many other unrelated media source files here |
|
Media Capture |
System services for media capture including camera/microphone access |
Contains CamerasChild, CamerasParent, VideoEngine, and platform-specific implementations |
|
Media Encoding |
Media encoders for recording, including Opus and VP8 track encoders |
||
Media Codecs |
Gecko Media Plugin (GMP) framework for sandboxed codec plugins |
Used by WebRTC for H.264 codec support |
|
Media Codecs |
Platform-specific encoder/decoder implementations (Apple, Android, FFmpeg, WMF) |
Contains PlatformEncoderModule and EncoderConfig used by WebRTC |
|
Data Channels |
SCTP-based data channel implementation |
||
Browser UI |
Browser-level WebRTC UI components including permission prompts and indicators |
||
Debugging |
Implementation of the about:webrtc debugging page |
||
Signalling |
WebRTC signaling implementation and GTests |
||
Tests |
Browser chrome tests for WebRTC getUserMedia and getDisplayMedia |
||
Tests |
Web Platform Tests for WebRTC conformance |
Also includes webrtc-encoded-transform, webrtc-extensions, webrtc-ice, webrtc-identity, webrtc-priority, webrtc-stats, webrtc-svc |
|
WebIDL (JS API) |
This contains the WebIDL definitions for the WebRTC JS API amongst many other WebIDL definitions |
|
Standards Documentation
When debugging API behavior it may be necessary to consult the specifications
for WebRTC. The ECMAScript API is defined in several W3C standards,
webrtc-pc, and
webrtc-stats. The number of IETF
standards that are incorporated into WebRTC are too numerous to list here. One
can find these standards in the
Normative References
section of the webrtc-pc spec.
Appendix: Delay Calculation
For all intents and purposes jitter and RTT are additive in nature. If there was 25ms of jitter reported and a RTT of 272ms, one could estimate the expected delay from transmission at the send side to play out on receive side to be
25ms + (272ms / 2) = 161ms
Appendix: WebRTC Glossary
Session Management Terms
Offer An SDP document created by one peer to initiate a connection, proposing media parameters and capabilities.
Answer An SDP document created in response to an offer, accepting or rejecting the proposed media parameters.
Pranswer (Provisional Answer) A preliminary answer that may be modified before the final answer is accepted, allowing for early media establishment.
Rollback The action of reverting to a previous stable session state, typically used when negotiation fails or needs to be cancelled. During offer/answer negotiation, the ICE agent automatically initiates rollback when an offer collision occurs (e.g., receiving an offer while in have-local-offer state). Learn more about perfect negotiation on MDN and RFC 9429 §4.1.10.2 and §5.7.
Perfect Negotiation A design pattern for WebRTC signaling that handles offer collisions gracefully using rollback, allowing both peers to attempt to be the offerer simultaneously without complex glare handling logic. Learn more about perfect negotiation on MDN.
Signaling State The current state of the offer/answer negotiation
process (stable, have-local-offer, have-remote-offer,
have-local-pranswer, have-remote-pranswer, closed). Learn
more about
signalingState
on MDN and RFC 9429
§3.2.
Pending Description An offer or answer that has been created or set but not yet matched with a corresponding answer or offer. Learn more about pendingLocalDescription and pendingRemoteDescription on MDN and RFC 9429 §4.1.14 and §4.1.16.
Current Description The currently active local or remote session description after successful negotiation. Learn more about currentLocalDescription and currentRemoteDescription on MDN and RFC 9429 §4.1.13 and §4.1.15.
Transport and Bundle Terms
Bundle Policy Controls how multiple media tracks are combined onto a
single transport (balanced, max-compat, max-bundle). Learn
more about
transports
and bundle
configuration
on MDN.
Bundle Level The m-line index of the media section that provides the transport for bundled media.
Transport ID A unique identifier for a transport used to carry media or data.
ICE Restart The process of restarting ICE candidate gathering and connectivity checks, typically to recover from network changes.
ICE Trickle A technique where ICE candidates are incrementally sent to the remote peer as they are gathered, rather than waiting for all candidates to be collected before beginning negotiation. Learn more about connectivity on MDN and trickle detection on in the JSEP spec.
ICE Credentials (ufrag/pwd) Username fragment and password used for ICE connectivity checks.
DTLS Fingerprint A cryptographic hash of the DTLS certificate used to verify the identity of the peer. Learn more about RTCCertificate fingerprints on MDN and RFC 8122 §5 and RFC 4572 §1.
ICE Lite A simplified ICE implementation that only acts as a controlled agent, used by servers. Learn more about ICE Lite in RFC 8445 §3.
ICE Controlling The ICE agent role that makes the final decision on which candidate pair to use.
Candidate An ICE candidate describing the protocols and routing needed for WebRTC to communicate with a remote device. Each candidate specifies network connectivity information including IP address, port, transport protocol, and candidate type (host, srflx, prflx, relay). Candidates are gathered during connection establishment and exchanged between peers. Learn more about RTCIceCandidate on MDN and RFC 8445 §2.
Candidate Pair A pairing of a local and remote ICE candidate that together describe a viable connection path between two WebRTC endpoints. During ICE connectivity checks, candidate pairs are tested to determine which provides the best connection. The selected candidate pair is used for media and data transport. Learn more about RTCIceCandidatePair and candidate pair stats on MDN and RFC 8445 §2.
Codec and Media Encoding Terms
Payload Type (PT) A numeric identifier (0-127) in RTP packets that identifies the codec being used. Payload types 0-95 are statically assigned for common codecs, while 96-127 are dynamically assigned and negotiated via SDP. Learn more about RTP parameters via the IANA registry where many of the relevant RFCs for specific formats are linked.
FMTP (Format Parameters) SDP attribute containing codec-specific parameters like profile, level, or packetization mode.
RTX (Retransmission) A mechanism for retransmitting lost RTP packets, using a separate payload type.
RED (Redundant Encoding) A mechanism for including redundant data in RTP packets to help with packet loss recovery.
ULPFEC (Uneven Level Protection Forward Error Correction) Forward error correction mechanism for protecting video streams against packet loss. Learn more about ULPFEC in RFC 5109 §1.
FEC (Forward Error Correction) Technique of adding redundancy to transmitted data to allow recovery from errors without retransmission.
Opus A versatile audio codec widely used in WebRTC, supporting both voice and music at various bitrates. Learn more about Opus on MDN.
VP8 An open video codec developed by Google, mandatory for WebRTC implementations. Learn more about VP8 on MDN.
VP9 An improved successor to VP8, offering better compression efficiency.
AV1 A modern open video codec offering significant compression improvements over VP9. Learn more about AV1 on MDN.
H.264/AVC (Advanced Video Coding) A widely-used video codec, mandatory for WebRTC implementations. Learn more about AVC/H.264 on MDN.
H.265/HEVC (High Efficiency Video Coding) A successor to H.264 offering improved compression efficiency, with hardware-dependent support in modern browsers. Chrome 136+ and Safari support H.265 in WebRTC when available via hardware. Learn more about video codecs on MDN.
G.722 A wideband audio codec operating at 64 kbit/s. Learn more about G.722 on MDN.
PCMU/PCMA G.711 audio codecs (μ-law and A-law) offering basic audio quality, mandatory for WebRTC. Learn more about G.711 on MDN.
RTP Header Extensions and Features
RTP Extension (extmap) RTP header extensions that carry additional metadata like audio levels or video orientation.
SSRC (Synchronization Source) A 32-bit identifier for a single source of RTP packets within an RTP session.
CNAME (Canonical Name) A persistent identifier for an RTP source that remains constant across SSRCs.
RID (Restriction Identifier) An identifier used in simulcast to distinguish between different encodings of the same source.
MID (Media Identification) An identifier that associates an RTP stream with a specific m-line in the SDP.
MSID (Media Stream Identification) An identifier that associates an RTP stream with a MediaStream and track.
Common RTP Header Extensions
RTP header extensions carry additional metadata in RTP packets using the framework defined in RFC 8285. All extensions must be negotiated via SDP before use.
Audio Level (Client-to-Mixer) Indicates the audio level of the RTP
packet payload in -dBov, allowing servers to identify active speakers
without decoding audio. URI:
urn:ietf:params:rtp-hdrext:ssrc-audio-level. Learn more about audio
level
indication
on MDN and RFC 6464
§1.
Audio Level (Mixer-to-Client) Indicates audio levels of contributing
sources in a mixed audio stream. URI:
urn:ietf:params:rtp-hdrext:csrc-audio-level. Learn more in RFC 6465
§1.
Video Orientation (CVO) Indicates the rotation needed for video
frames (0, 90, 180, 270 degrees) to support orientation changes. URI:
urn:3gpp:video-orientation. Learn more in 3GPP TS 26.114 and RFC
8285 §1.
Transport-Wide Sequence Number Provides sequence numbers for
transport-wide congestion control feedback. URI:
http://www.ietf.org/id/draft-holmer-rmcat-transport-wide-cc-extensions.
Learn more in draft-holmer-rmcat-transport-wide-cc-extensions
§2.
MID Header Extension Carries the media identification tag in RTP
packets for bundle multiplexing. URI:
urn:ietf:params:rtp-hdrext:sdes:mid. Learn more in RFC 9143
§1.
RID Header Extension Identifies RTP streams in simulcast scenarios.
URI: urn:ietf:params:rtp-hdrext:sdes:rtp-stream-id. Learn more in
RFC 8852 §1.
Absolute Capture Time Timestamps packets with NTP time when media
was captured, enabling audio-video synchronization across hops. URI:
http://www.webrtc.org/experiments/rtp-hdrext/abs-capture-time. Learn
more in draft-ietf-avtcore-abs-capture-time
§1.
Transmission Time Offset Communicates the offset between RTP
timestamp and actual transmission time, useful for handling
retransmissions and buffering. URI:
urn:ietf:params:rtp-hdrext:toffset. Learn more in RFC 5450
§1.
Absolute Send Time Timestamps packets with departure time from the
sender, providing precise timing for bandwidth estimation. URI:
http://www.webrtc.org/experiments/rtp-hdrext/abs-send-time. Learn
more in the abs-send-time
specification.
Video Content Type Indicates whether video is screenshare or camera
content, enabling optimized rendering. URI:
http://www.webrtc.org/experiments/rtp-hdrext/video-content-type.
Learn more in the video-content-type
specification.
Video Timing Provides per-frame timing information including encode
start/finish, packetization, and pacer timestamps for performance
analysis. URI:
http://www.webrtc.org/experiments/rtp-hdrext/video-timing. Learn
more in the video-timing
specification.
Playout Delay Allows sender to specify minimum and maximum playout
delay ranges, enabling latency control for different use cases (gaming,
streaming, conferencing). URI:
http://www.webrtc.org/experiments/rtp-hdrext/playout-delay. Learn
more in the playout-delay
specification.
Color Space Communicates color space information and HDR metadata
for proper video rendering. URI:
http://www.webrtc.org/experiments/rtp-hdrext/color-space. Learn more
in the color-space
specification.
Video Frame Tracking ID Propagates VideoFrame ID field through RTP
packets for frame tracking. URI:
http://www.webrtc.org/experiments/rtp-hdrext/video-frame-tracking-id.
This is only for quality testing purposes and should not be used in
production. Learn more in the video-frame-tracking-id
specification.
Dependency Descriptor Conveys information about video frames and
their dependencies in a codec-agnostic way, enabling selective
forwarding without decoding. Designed for AV1 but useful for other
codecs. URI:
https://aomediacodec.github.io/av1-rtp-spec/#dependency-descriptor-rtp-header-extension.
Learn more in the AV1 RTP
specification.
SDES Items in RTP Headers Allows rapid delivery of RTCP Source Description items (like CNAME) via RTP header extensions. Learn more in RFC 7941 §1.
Simulcast and Encoding Terms
Simulcast Simultaneously sending multiple encoded versions of the same video source at different qualities. Codecs may have optimizations that improve performance when encoding the same frame at different resolutions.
SVC (Scalable Video Coding) A video coding technique that encodes a single bitstream that can be decoded at different resolutions, frame rates, or quality levels to adapt to varying network conditions and receiver capabilities. Unlike simulcast which sends multiple independent streams, WebRTC SVC produces one encoded stream on a single SSRC. Scalability modes use L for spatial layers (resolution scalability) and T for temporal layers (frame rate scalability), such as L1T2 or L3T3. SVC is particularly useful for Selective Forwarding Units (SFUs) which can selectively forward layers to adapt to varying network conditions without re-encoding. Learn more about scalability modes on MDN and in the W3C Scalable Video Coding (SVC) Extension specification.
Encoding A single encoded representation of media, identified by an SSRC or RID.
Send Track / Recv Track Internal representation of media direction - tracks for sending media and tracks for receiving media.
Transceiver A pairing of a sender and receiver that share a common mid value, managing bidirectional media.
Negotiated Details The final agreed-upon parameters for a track after offer/answer negotiation completes.
SDP Attributes and Parameters
M-line (Media Description Line) An SDP line beginning with m=
that defines a media stream, specifying the media type (audio, video,
etc.), port, transport protocol, and codec format. The interpretation of
the format is dependent on the selected protocol. Each m-line starts a
new media section that continues until the next m-line or end of the
SDP. Learn more about
SDP on MDN
and RFC 8866
§5.14.
Direction Attribute SDP attribute indicating media stream direction
(sendrecv, sendonly, recvonly, inactive).
Setup Role DTLS role in the connection (active, passive,
actpass) determining who initiates the handshake.
TIAS (Transport Independent Application Specific Maximum) Bandwidth constraint indicating maximum bitrate in bits per second. Learn more about maxBitrate on MDN and RFC 3890 §6.2.2.
H.264 Format Parameters
H.264 Profile Level ID H.264-specific parameter indicating the codec
profile (baseline, main, high) and level (capability). Signaled in SDP
via the profile-level-id FMTP parameter. Learn more about H.264
profile-level-id
on MDN and RFC 6184
§8.1.
H.264 Max-FS (Maximum Frame Size) Video codec parameter limiting the
maximum number of macroblocks in a frame. Signaled in SDP via the
max-fs FMTP parameter for H.264. Learn more about
max-fs
on MDN and RFC 6184
§8.1.
H.264 Max-FR (Maximum Frame Rate) Video codec parameter limiting the
maximum frame rate in frames per second. Signaled in SDP via the
max-fr FMTP parameter for H.264. Learn more about
maxFramerate
on MDN and RFC 6184
§8.1.
H.264 Max-BR (Maximum Bitrate) Video codec parameter limiting the
maximum bitrate. Signaled in SDP via the max-br FMTP parameter for
H.264. Learn more about
maxBitrate
on MDN and RFC 6184
§8.1.
H.264 Max-MBPS (Maximum Macroblocks Per Second) H.264 parameter
limiting the processing rate. Signaled in SDP via the max-mbps FMTP
parameter. Learn more about
max-mbps
on MDN and RFC 6184
§8.1.
H.264 Sprop-parameter-sets H.264 parameter containing SPS/PPS data
for decoder initialization. Signaled in SDP via the
sprop-parameter-sets FMTP parameter. Learn more in RFC 6184
§8.1.
H.264 Packetization Mode H.264 parameter specifying the
packetization method for RTP packets. Mode 0 uses single NAL unit
packets, while Mode 1 allows for more efficient fragmentation and
aggregation of NAL units. Signaled in SDP via the packetization-mode
FMTP parameter. Learn more in RFC 6184
§8.1.
VP8 Format Parameters
VP8 Max-FS (Maximum Frame Size) VP8 parameter limiting the maximum
frame size in units of macroblocks that the decoder can decode. The
decoder can handle frame widths and heights up to int(sqrt(max-fs * 8))
macroblocks. For example, max-fs=1200 supports up to 640x480 resolution
(97 macroblocks width/height, or 1552 pixels). Signaled in SDP via the
max-fs FMTP parameter. Learn more in RFC 7741
§6.1.
VP8 Max-FR (Maximum Frame Rate) VP8 parameter limiting the maximum
frame rate in frames per second that the decoder can decode. Signaled in
SDP via the max-fr FMTP parameter. Learn more in RFC 7741
§6.1.
VP9 Format Parameters
VP9 Profile-ID VP9 parameter indicating the codec profile (0-3).
Profile 0 supports 8-bit 4:2:0 only, Profile 1 adds 8-bit 4:2:2/4:4:4,
Profile 2 adds 10/12-bit 4:2:0, and Profile 3 adds 10/12-bit
4:2:2/4:4:4. When not present, a value of 0 is inferred. Signaled in SDP
via the profile-id FMTP parameter. Learn more in RFC 9628
§6.
VP9 Max-FS (Maximum Frame Size) VP9 parameter limiting the maximum
frame size in units of macroblocks that the decoder can decode. Signaled
in SDP via the max-fs FMTP parameter. Learn more in RFC 9628
§6.
VP9 Max-FR (Maximum Frame Rate) VP9 parameter limiting the maximum
frame rate in frames per second that the decoder can decode. Signaled in
SDP via the max-fr FMTP parameter. Learn more in RFC 9628
§6.
AV1 Format Parameters
AV1 Profile AV1 parameter indicating the codec profile (Main, High,
or Professional). The profile determines the supported bit depths and
chroma subsampling formats. Signaled in SDP via the profile
parameter. Learn more in the AV1 RTP
specification.
AV1 Level-IDX AV1 parameter indicating the level, which defines the
decoder’s maximum processing capabilities including resolution, frame
rate, and bitrate. Signaled in SDP via the level-idx parameter.
Learn more in the AV1 RTP
specification.
AV1 Tier AV1 parameter indicating the tier (Main or High), which
determines the maximum bitrate for a given level. High tier allows
roughly 2x the bitrate of Main tier. Signaled in SDP via the tier
parameter. Learn more in the AV1 RTP
specification.
H.265/HEVC Format Parameters
H.265 Profile-ID H.265 parameter indicating the codec profile along
with profile-space. Profiles include Main, Main 10, Main Still Picture,
and others that determine supported bit depths and features. Signaled in
SDP via the profile-id FMTP parameter. Learn more in RFC 7798
§7.1.
H.265 Level-ID H.265 parameter indicating the level, which defines
the decoder’s maximum processing capabilities including resolution,
frame rate, and bitrate. Signaled in SDP via the level-id FMTP
parameter. Learn more in RFC 7798
§7.1.
H.265 Tier-Flag H.265 parameter indicating the tier (Main=0 or
High=1), which determines the maximum bitrate for a given level. High
tier supports higher bitrates than Main tier at the same level. Signaled
in SDP via the tier-flag FMTP parameter. Learn more in RFC 7798
§7.1.
H.265 Max-LSR (Maximum Luma Sample Rate) H.265 parameter indicating
the maximum processing rate in units of luma samples per second,
allowing receivers to signal capabilities beyond the base level
requirements. Signaled in SDP via the max-lsr FMTP parameter. Learn
more in RFC 7798
§7.1.
H.265 Max-FPS (Maximum Frame Rate) H.265 parameter indicating the
maximum picture rate in units of pictures per 100 seconds, used to
signal a constraint that lowers the maximum picture rate. Signaled in
SDP via the max-fps FMTP parameter. Learn more in RFC 7798
§7.1.
H.265 Max-BR (Maximum Bitrate) H.265 parameter indicating the
maximum bitrate capability of the receiver, extending beyond the base
level requirements. Signaled in SDP via the max-br FMTP parameter.
Learn more in RFC 7798
§7.1.
H.265 Max-CPB (Maximum Coded Picture Buffer) H.265 parameter
indicating the maximum coded picture buffer size capability, allowing
receivers to signal support for larger buffers than required by the base
level. Signaled in SDP via the max-cpb FMTP parameter. Learn more in
RFC 7798 §7.1.
H.265 Sprop-VPS/SPS/PPS H.265 parameters containing VPS (Video
Parameter Set), SPS (Sequence Parameter Set), and PPS (Picture Parameter
Set) data for out-of-band decoder initialization. Signaled in SDP via
the sprop-vps, sprop-sps, and sprop-pps FMTP parameters.
Learn more in RFC 7798
§7.1.
RTCP Feedback Types
RTCP Feedback (rtcp-fb) Mechanisms for providing rapid feedback about media quality and requests.
NACK (Negative Acknowledgment) RTCP feedback requesting retransmission of lost packets.
PLI (Picture Loss Indication) RTCP feedback requesting a full intra-frame when video decoding fails. Learn more about PLI in RFC 4585 §6.3.1.
FIR (Full Intra Request) RTCP feedback requesting a full intra-frame for decoder refresh. Learn more about FIR in RFC 2032 §5.2.1.
TMMBR (“timber”, Temporary Maximum Media Stream Bitrate Request) RTCP feedback for requesting bitrate reduction. Learn more about TMMBR in RFC 5104 §3.5.4.
REMB (Receiver Estimated Maximum Bitrate) RTCP feedback communicating receiver’s bandwidth estimate to the sender. Learn more about REMB in draft-alvestrand-rmcat-remb §2.
Transport-CC (Transport-wide Congestion Control) Mechanism for gathering packet arrival times to estimate available bandwidth. Learn more about transport-cc in draft-holmer-rmcat-transport-wide-cc-extensions §2.
FlexFEC Flexible forward error correction mechanism for RTP streams that can protect against packet loss by sending redundant recovery packets. Uses a separate RTP stream for FEC packets, allowing flexible configuration of protection levels. Learn more about FlexFEC in RFC 8627 §1.
Audio-Specific Terms
DTX (Discontinuous Transmission) Not transmitting audio packets
during silence to save bandwidth. Signaled in SDP via the usedtx
FMTP parameter for Opus. Learn more about DTX in supported audio
codecs
on MDN and RFC 7587
§6.1.
In-band FEC Opus-specific forward error correction included within
the audio stream. Signaled in SDP via the useinbandfec FMTP
parameter. Learn more in RFC 7587
§6.1.
Stereo Two-channel audio encoding. Stereo can either be independently encoded or, in some codecs like Opus, joint encoded.
Ptime (Packet Time) The duration of media represented in a single RTP packet, in milliseconds. Learn more about ptime in RFC 8866 §6.4.
Maxptime (Maximum Packet Time) The maximum acceptable ptime value. Learn more about maxptime in RFC 8866 §6.4.
CBR (Constant Bitrate) Encoding mode where bitrate remains constant
regardless of content complexity. For Opus, signaled in SDP via the
cbr FMTP parameter. Learn more in RFC 7587
§6.1.
VBR (Variable Bitrate) Encoding mode where bitrate varies based on content complexity, allowing more efficient compression. This is the default mode for many codecs like Opus.
ABR (Adaptive Bitrate) Encoding mode that dynamically adjusts bitrate in real-time based on network conditions and receiver feedback. In WebRTC, ABR uses bandwidth estimation algorithms (like Transport-CC) to continuously monitor connection quality and adapt the encoding bitrate to maintain optimal quality while preventing congestion. This differs from VBR which adapts to content complexity but not network conditions. Learn more about bandwidth estimation on MDN.
Data Channel Terms
SCTP (Stream Control Transmission Protocol) Protocol used for WebRTC data channels, providing reliable or unreliable delivery. Learn more about RTCSctpTransport on MDN and RFC 9260 §1.
Data Channel A bidirectional data transport for arbitrary application data over WebRTC. Learn more about RTCDataChannel on MDN and RFC 8831 §6.4.
SCTP Port The port number used for SCTP associations in data channels.
Max Message Size The maximum size of a single message that can be sent over a data channel.
Session State and Lifecycle
Associated A transceiver that has been assigned a mid value during negotiation.
Negotiated A transceiver that has completed offer/answer exchange and has agreed parameters.
Stopped A transceiver that has been permanently stopped and cannot be reused.
Receptive A transceiver’s ability to receive media based on the local description.
Add Track Magic Special negotiation behavior where transceivers
created via addTrack() can be reused during negotiation, unlike
those created with addTransceiver(). When applying a remote offer,
addTrack()-created transceivers may be “stolen” to match incoming
m-lines, while addTransceiver()-created transceivers are never
reused. Learn more about
addTrack
and
addTransceiver
on MDN.
Advanced Terms
Subprofile H.264 profiles like Constrained Baseline, Baseline, Main,
High, etc. Signaled in SDP via the profile-level-id FMTP parameter.
Learn more in RFC 6184
§8.1.
Level Asymmetry Allowed H.264 parameter allowing different encoding
levels in each direction. Signaled in SDP via the
level-asymmetry-allowed FMTP parameter. Learn more in RFC 6184
§8.1.
Unique Receive Payload Types Payload types that can be uniquely identified for SSRC-to-PT matching.
Preferred Codecs User-specified codec ordering that overrides defaults. See Codec Preferences.
Codec Preferences Settings controlling which codecs are enabled and
their configurations, specified as an array of RTCRtpCodecCapability
objects in order of decreasing preference. Set via
setCodecPreferences() on an RTCRtpTransceiver to control which
codecs are used during negotiation. Codecs not included in the
preferences are excluded from negotiation. An empty list resets to user
agent defaults. Learn more about
setCodecPreferences
on MDN.
RTCRtpScriptTransform An interface that enables custom processing of
encoded audio and video frames in WebRTC by inserting transform streams into
sender and receiver pipelines. The transform runs in a Worker thread and
receives encoded frames through a TransformStream, allowing real-time frame
manipulation, encryption, analytics, or bandwidth optimization. Developers
assign transforms to RTCRtpSender.transform for outgoing frames or
RTCRtpReceiver.transform for incoming frames. The worker receives an
rtctransform event with a transformer object containing readable and
writable streams for processing. Learn more about
RTCRtpScriptTransform
and Using WebRTC Encoded Transforms
on MDN.